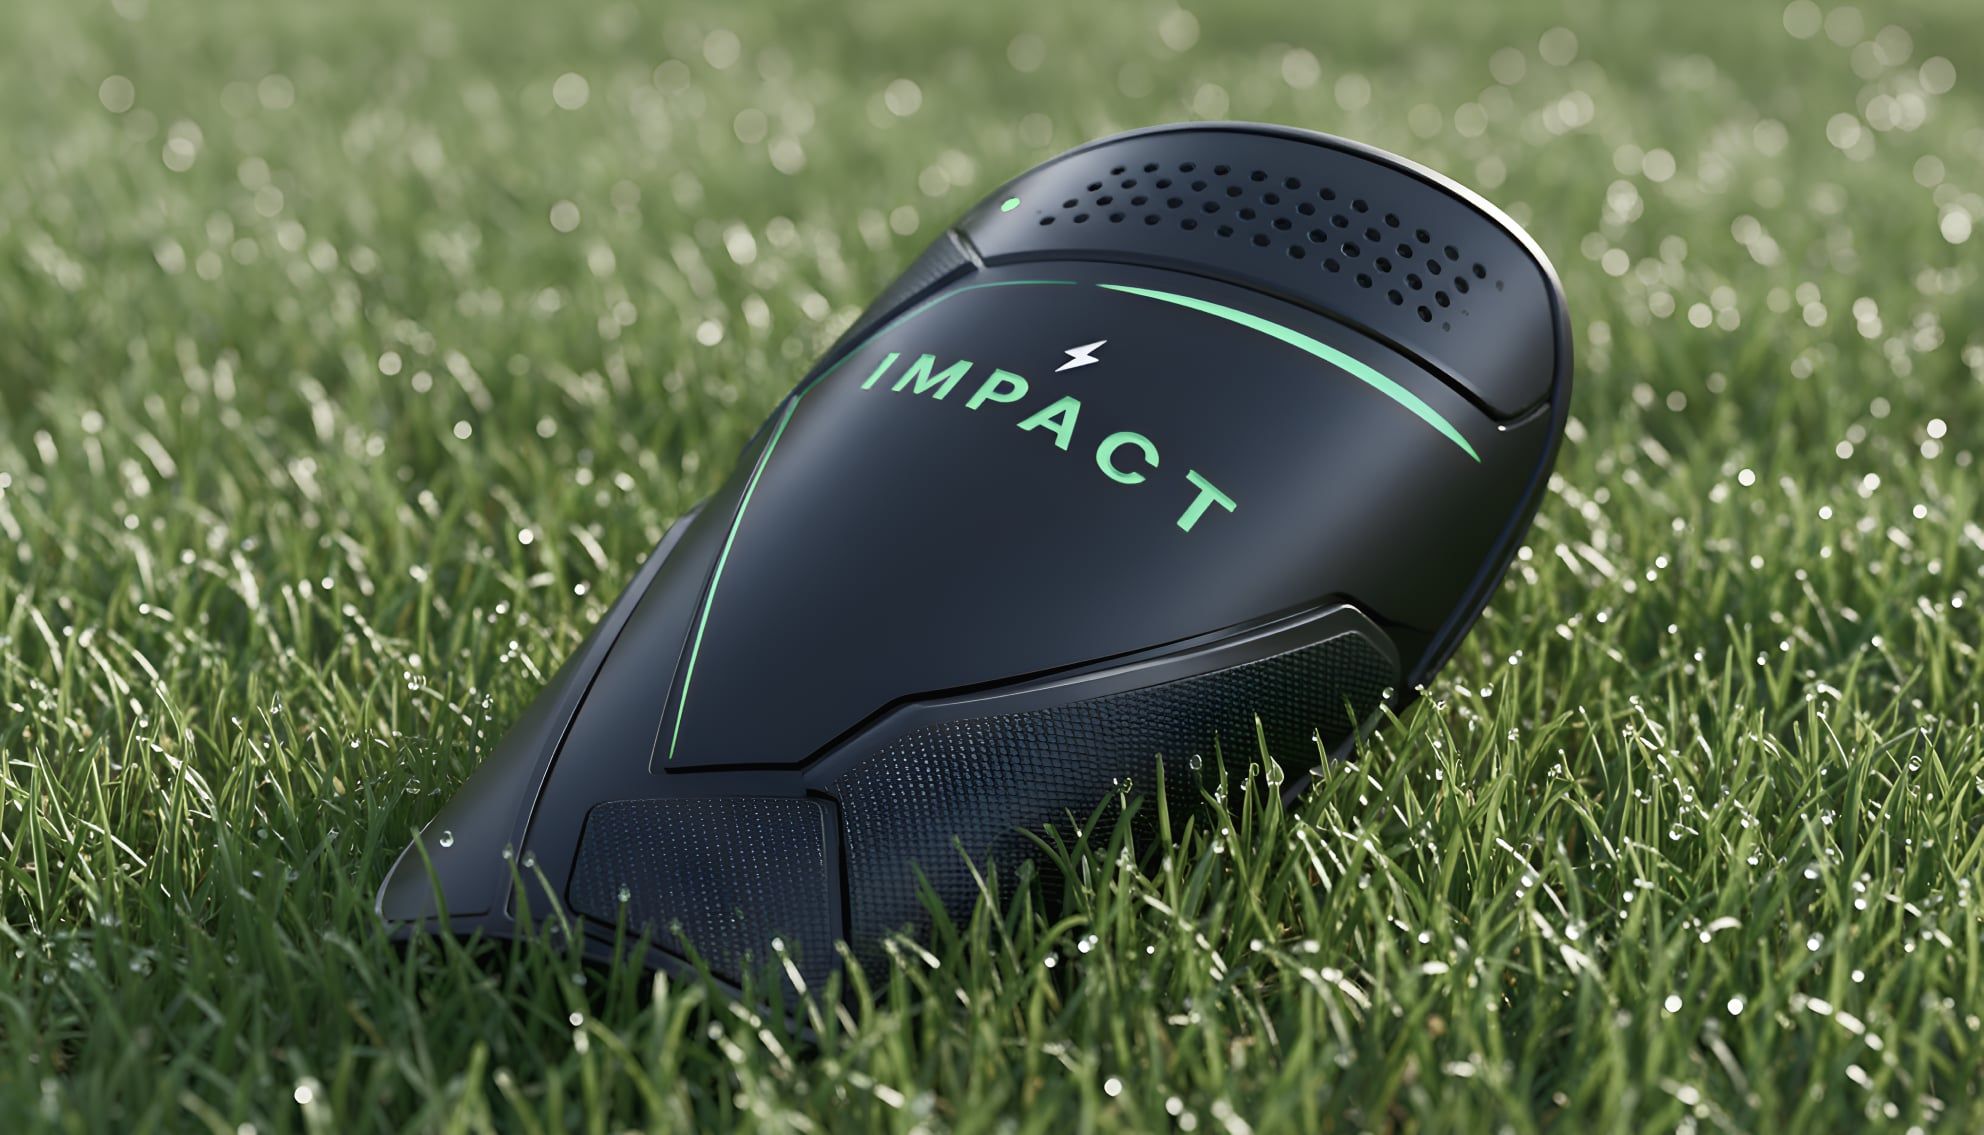
IMPACT: Smart Shin Guards
An interactive digital product for the 2026 FIFA World Cup that connects physical soccer experiences with digital interactions to enhance player performance.
Overview
IMPACT is a smart shin guard and companion app for the 2026 FIFA World Cup. Sensors in the shin guard measure impact, workload and recovery right at the leg, and the app turns that data into insights players can use on practice and match day.
I designed IMPACT as a solo project for IXD 412, Interaction Design 3, at the University of Kansas, from field research and competitive analysis through branding, a design system and a high-fidelity prototype.
Built for Practice & Match Day
Impact Tracking
Measures force intensity and frequency during play.
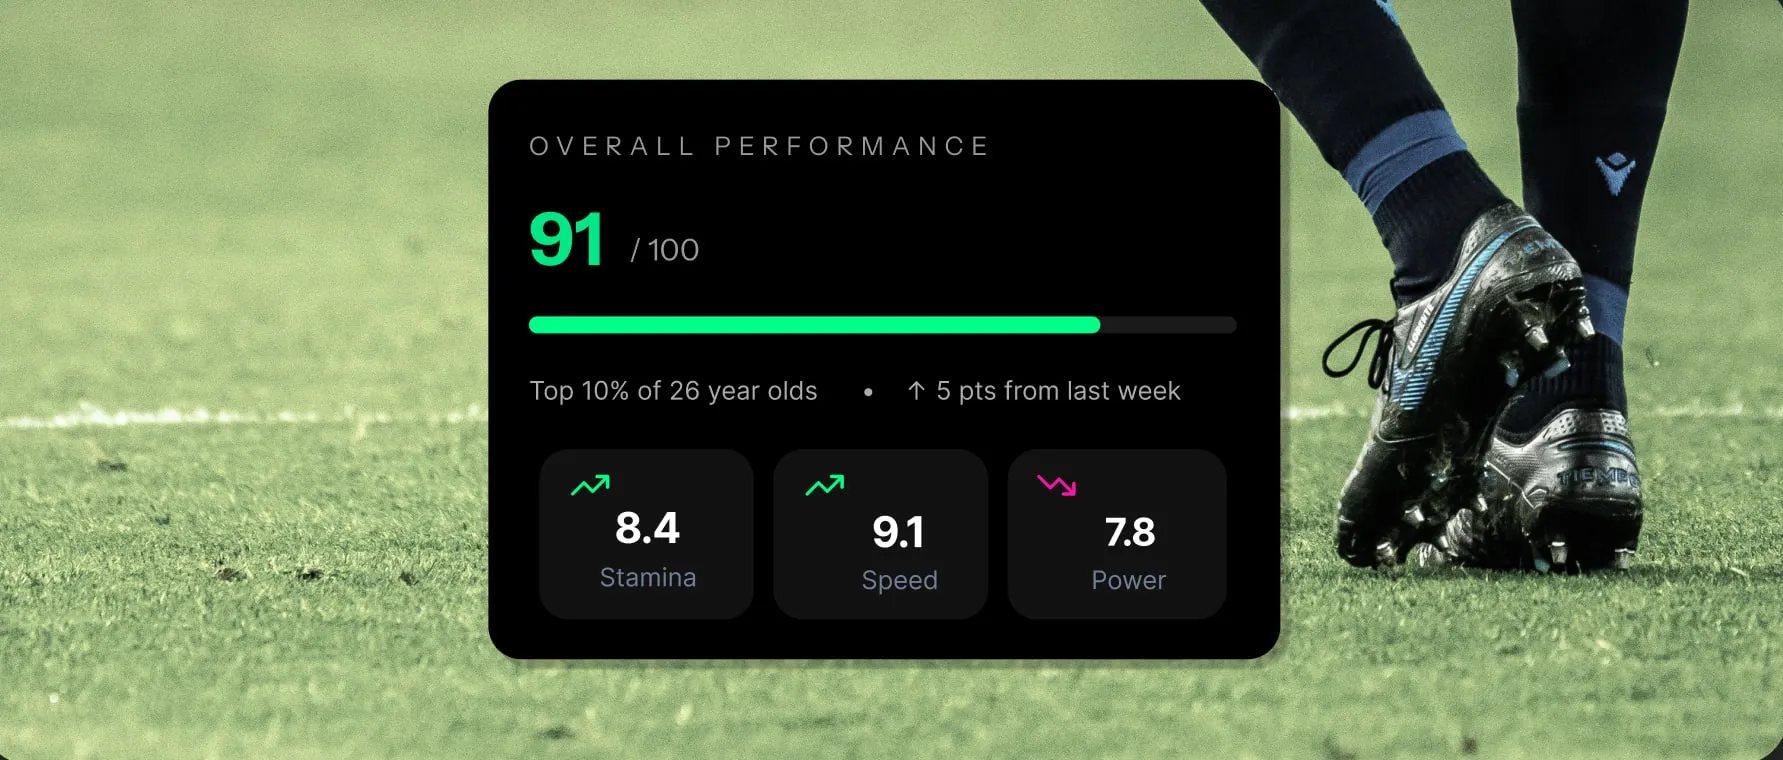
Injury Risk Alerts
AI-driven notifications when impact exceeds safe thresholds.
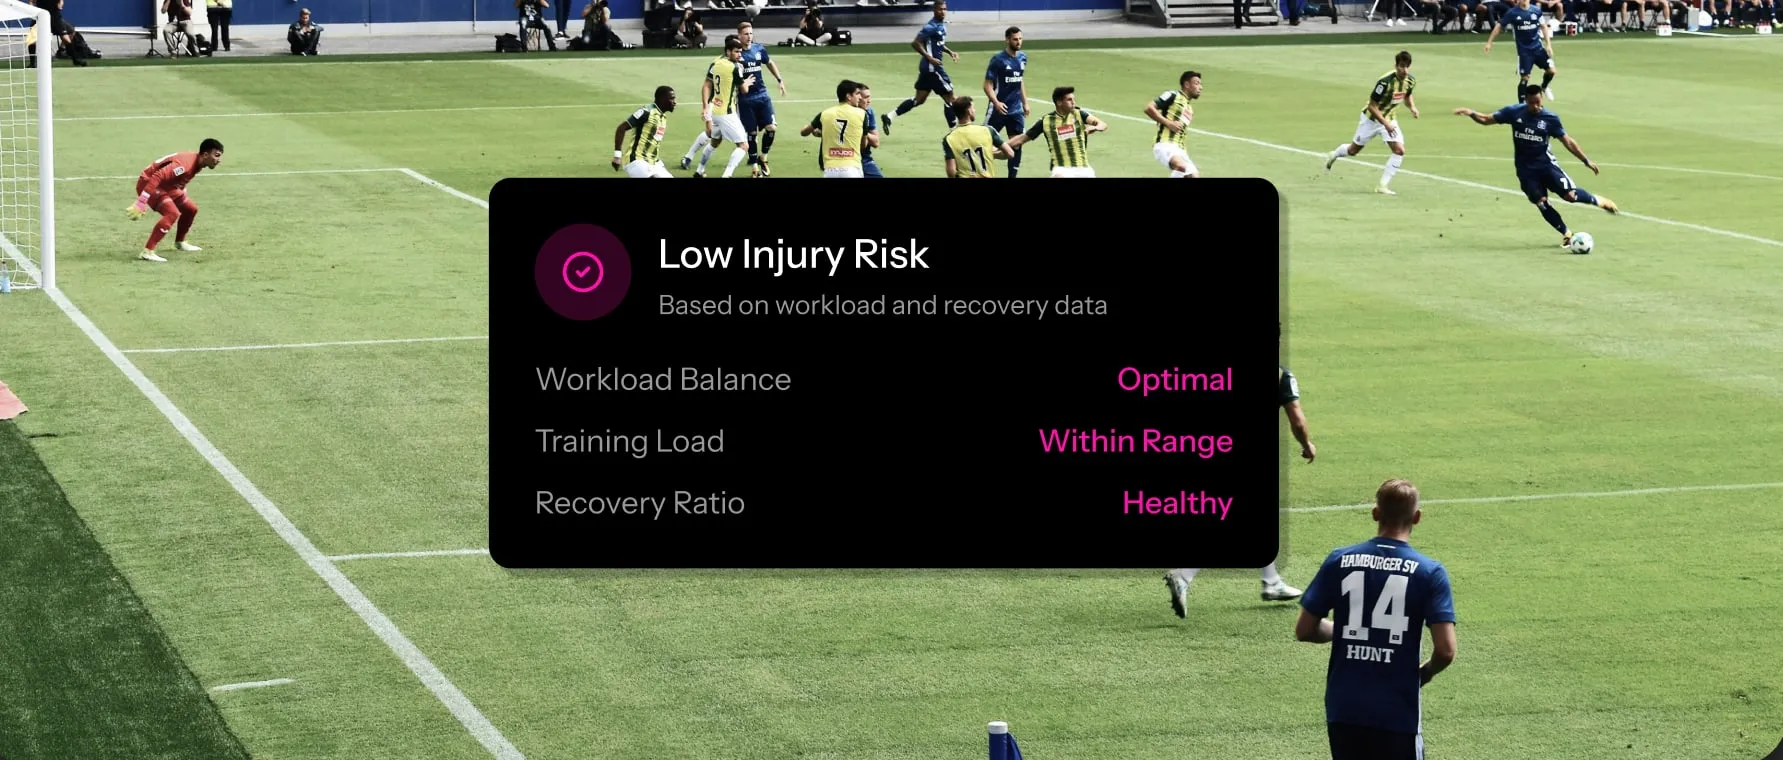
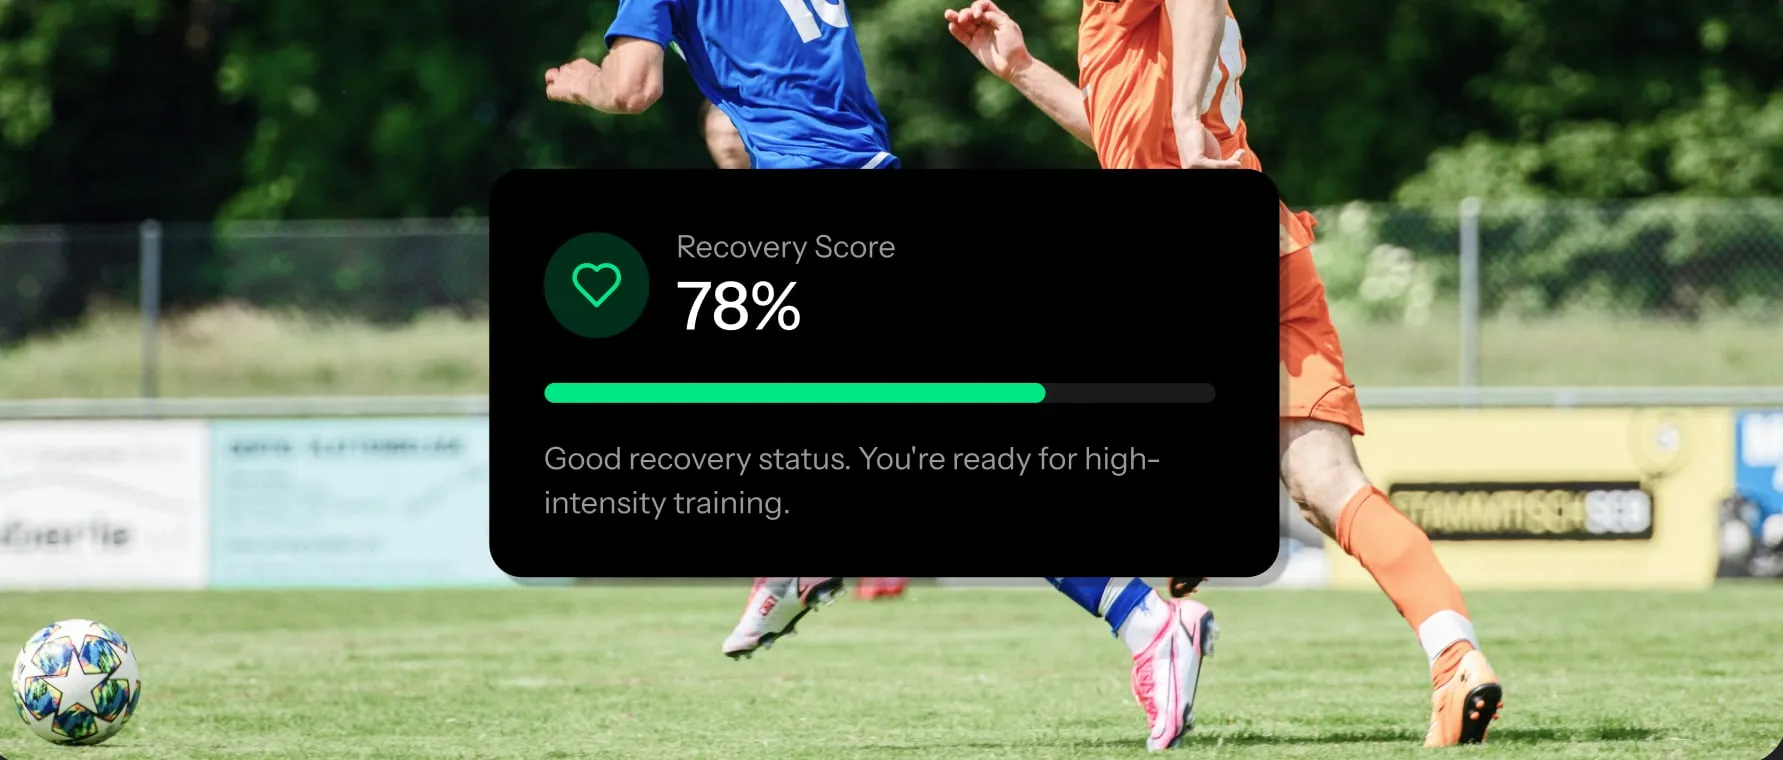
Recovery Integration
Syncs with post-game recovery insights and wellness metrics.
Problem
Performance tracking today relies on satellite GPS units worn on the back of the jersey or in a chest strap. They only work outdoors, capture movement rather than technical performance, and players find chest straps restrictive.
The shin guards players already wear don’t help either: they absorb sweat and slip, need readjusting during games, and offer no performance feedback.
Research
The Shift in Performance Tracking
Current systems rely on satellite GPS. The future of performance tracking is leg-based inertial measurement unit (IMU) precision.
Leg Placement= Better Data
GPS units are typically worn on the back of the jersey. Placing sensors on the shin captures technical performance, not just movement.
IndoorAdvantage
GPS only works outside; IMU works anywhere. Reliable tracking in any environment builds trust and consistency.
Comfort= Adoption
Performance technology must feel invisible to ensure consistent use. If athletes feel it, they won’t wear it.
Motivationvs. Mastery
Gamification attracts users, but actionable insights drive improvement and transform an athlete’s performance.
Field research
I observed 35 athletes at a KU Women’s Soccer practice focused on footwork, passing, shooting and using both legs. Shin guards were rarely adjusted in practice, but more often in high-intensity games. I also ran a user study where architecture and design students played warmups, drills and a 7v7 game, to understand player movement, decision-making and physical demands.
The key observation: players rely heavily on their dominant foot.
“I want to track my left vs. right foot usage and other metrics, without needing to wear another device, such as a VX bra.”
Faith Johnston, freshman KU soccer player
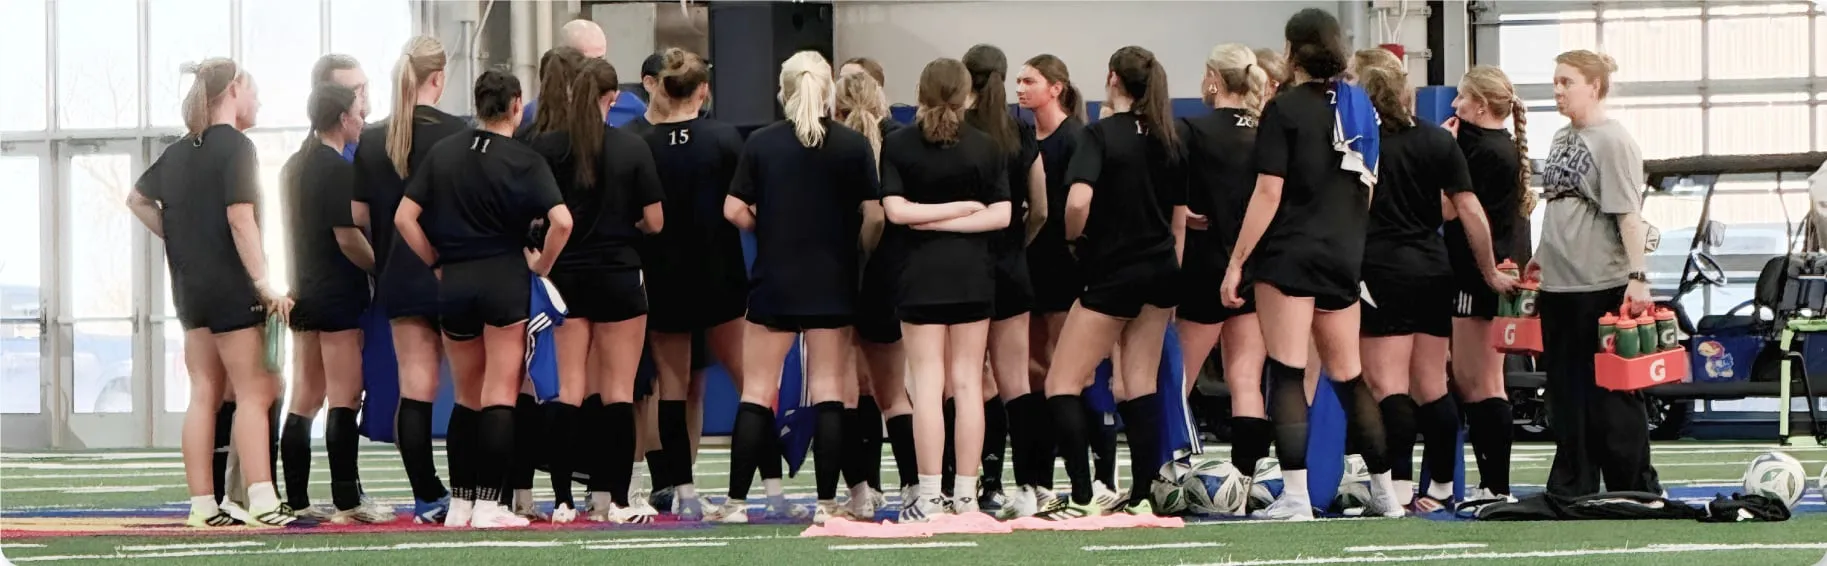
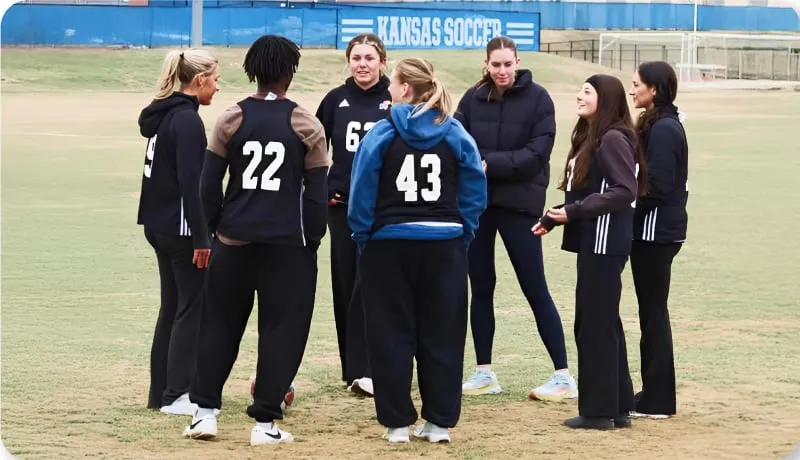
Players value lightweight, low-profile gear, equipment that doesn’t distract during play, performance data that supports improvement, and recovery insights. Current shin guards absorb sweat and slip, need readjusting during games, offer no performance feedback, and have no IMU tracking.
Competitive analysis
Industry Snapshot
Understanding the market landscape and key players to identify opportunities for differentiation.

Flick
Direct competitor
Strengths
- Position personalization
- Built-in shin guard chip
- Global leaderboard
Weaknesses
- Overloaded stats
- Nav bar inconsistency
- Overwhelming design
Key takeaways
- Gamification motivates
- Lots of data overwhelms
- Accessibility = trust
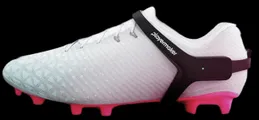
Playmaker
Indirect competitor
Strengths
- Thoughtful onboarding
- Technical foot metrics
- Strong visual hierarchy
Weaknesses
- Locked behind purchase
- Less social competition
- Limited preview access
Key takeaways
- Clarity > complexity
- Pros want technical depth
- Clean visuals = credibility
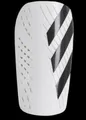
Adidas
Indirect competitor
Strengths
- Zero learning curve
- Lightweight + minimal
- Trusted brand
Weaknesses
- No performance data
- No feedback loop
- Not sweat resistant
Key takeaways
- Comfort is critical
- Simplicity builds trust
- Tech must not affect fit
User persona
Designing for Pro Soccer Players
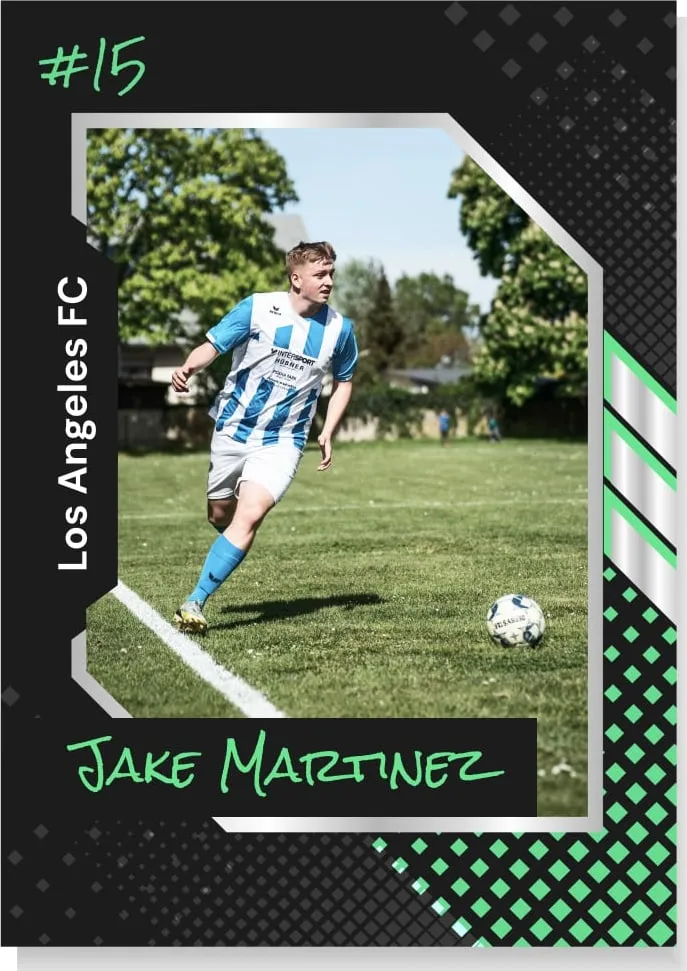
Player profile
- Age:
- 26 years old
- Occupation:
- Professional soccer player (6 years pro)
- Location:
- Los Angeles, California
- Position:
- Midfielder
Performance priorities
- Prevent injury and extend career longevity
- Track left vs. right leg workload imbalance
On-field challenges
- Hard to detect early asymmetry or overuse in legs
- Wearing chest straps feels restrictive or unnatural
I wish I could monitor impact and stress on my legs after practices or games, so that I can extend my career.
I wish I could share data easily with trainers and medical staff, so we can make informed decisions together.
Process
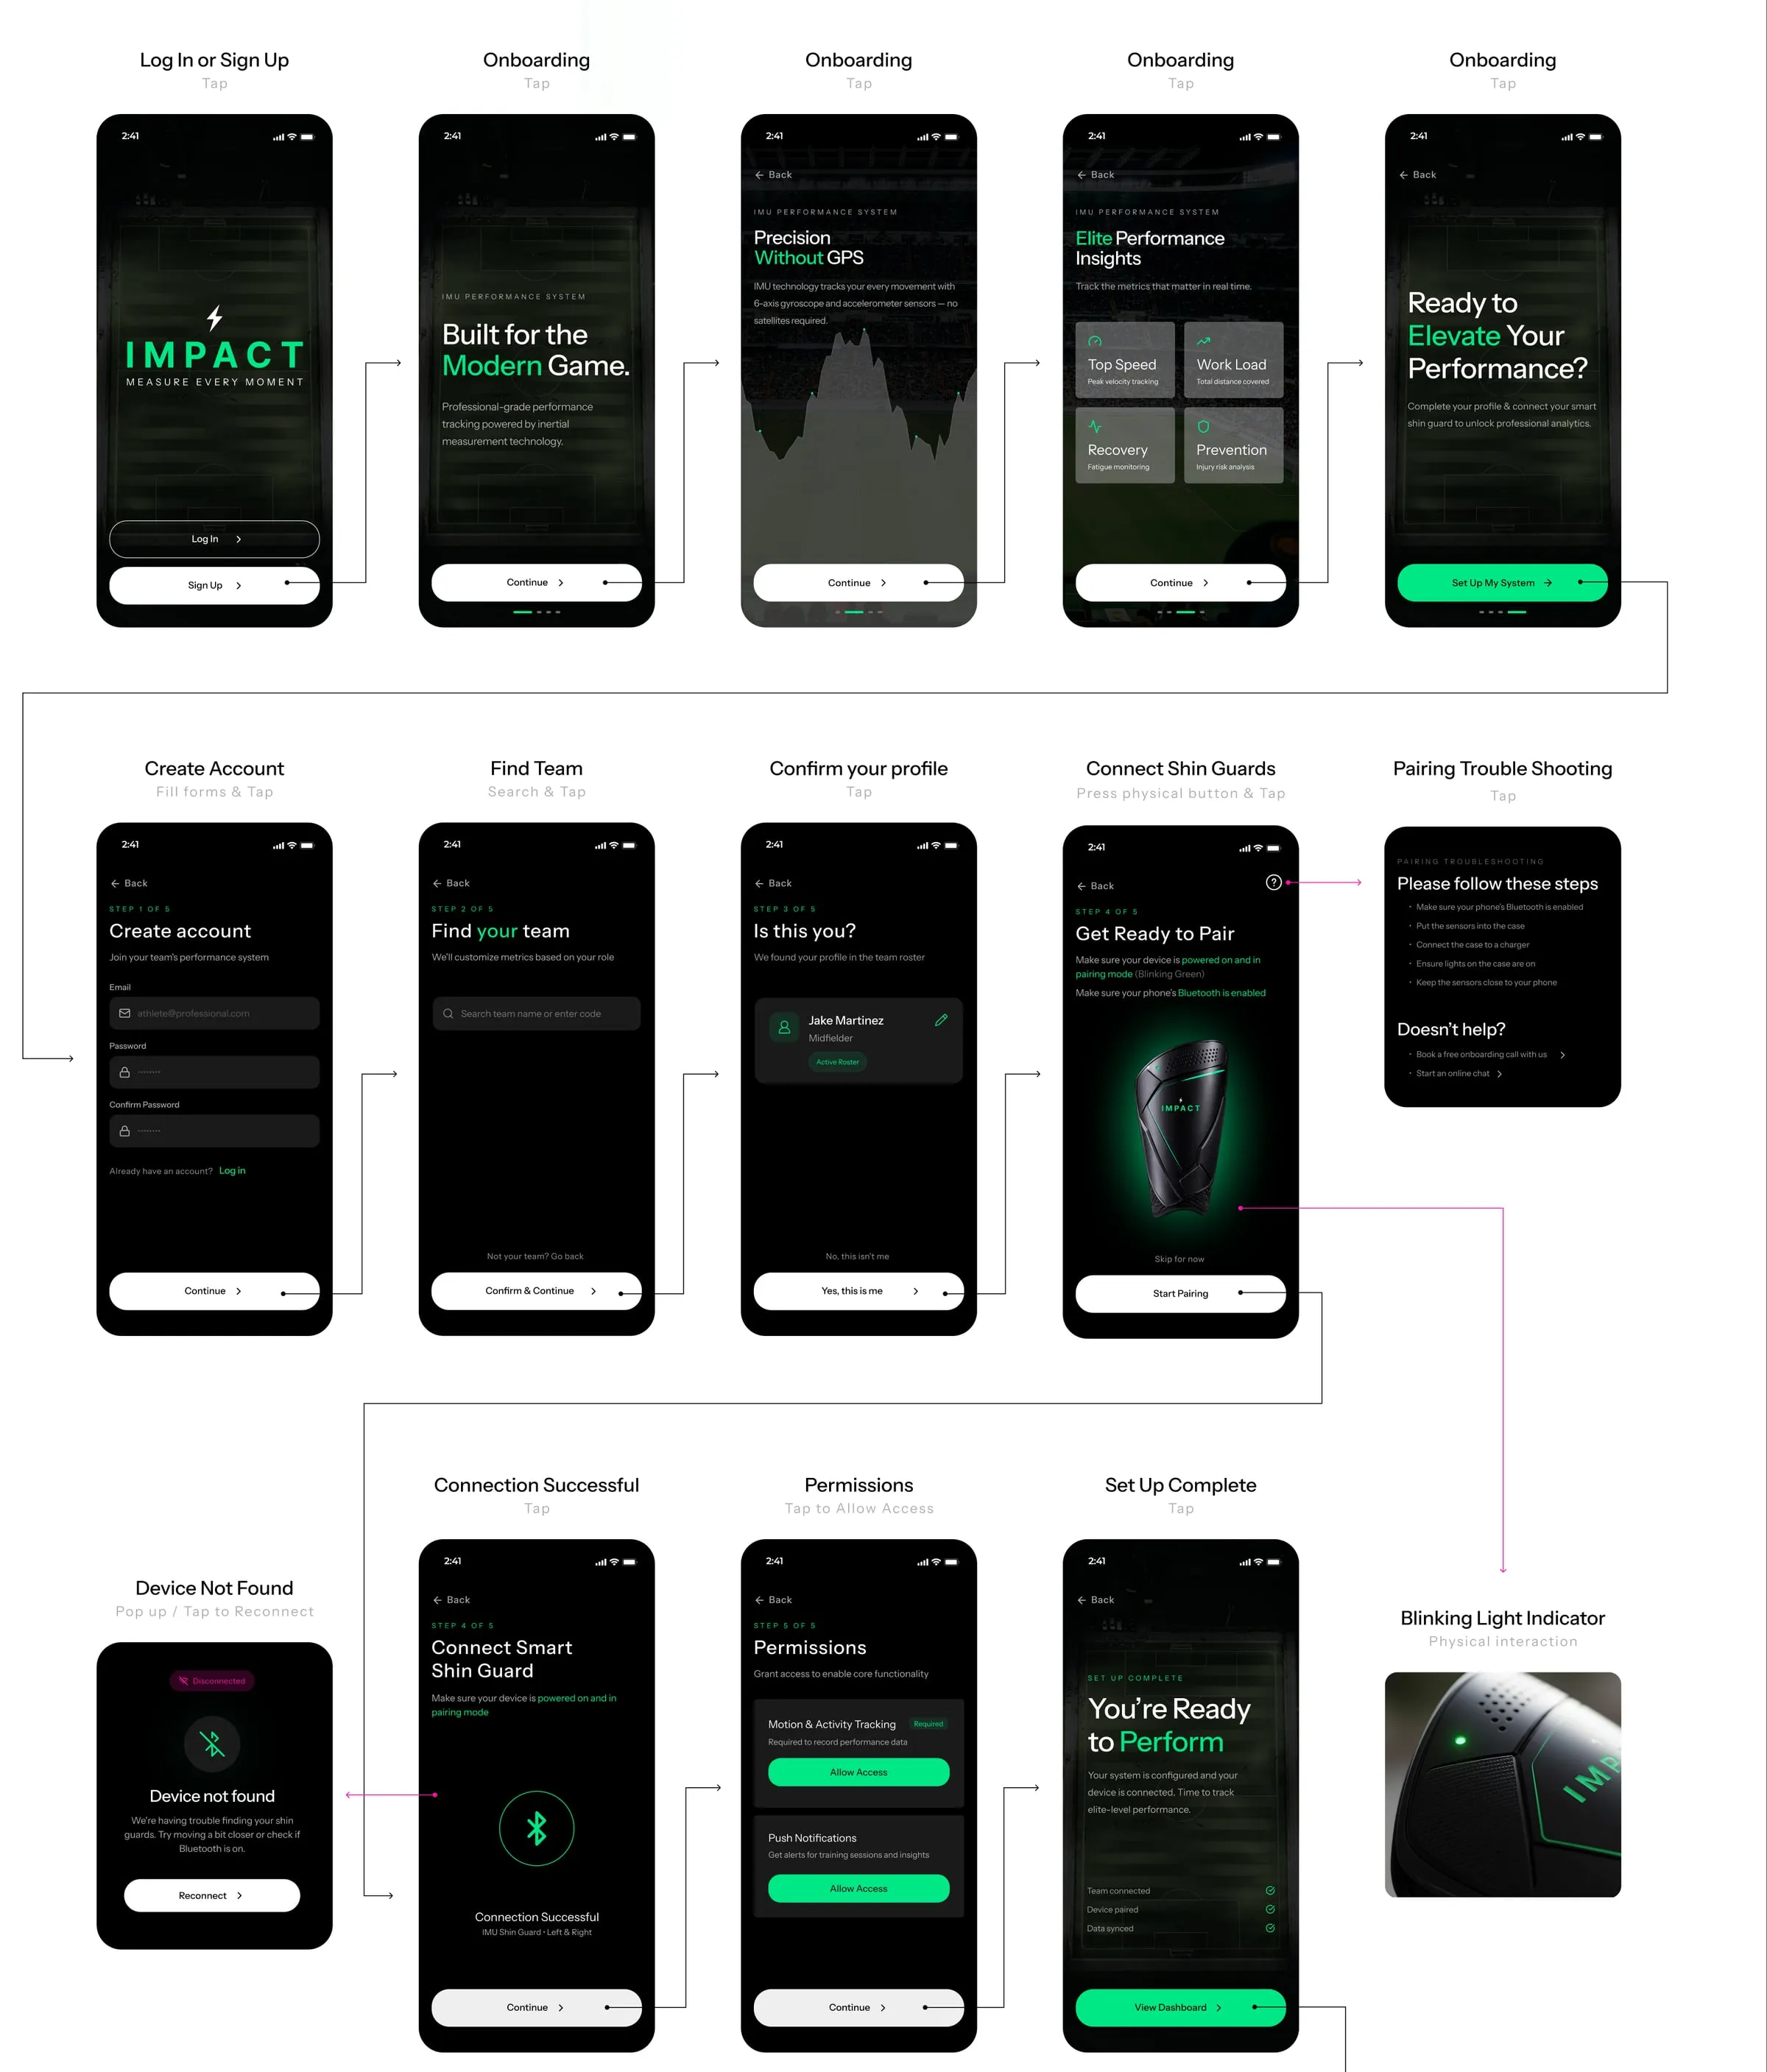
I mapped the full journey from sign-up and onboarding through finding a team, pairing the shin guards and granting permissions, including error states such as a device not being found.
User testing
A/B Testing
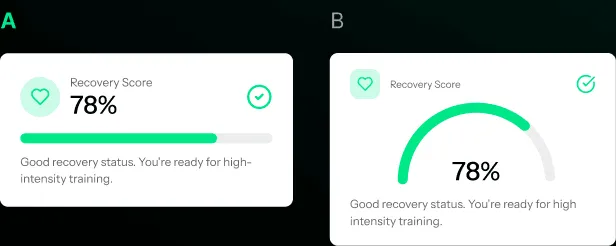
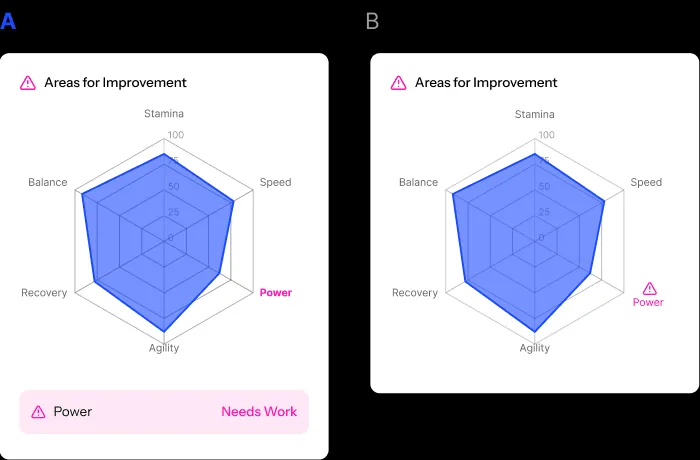
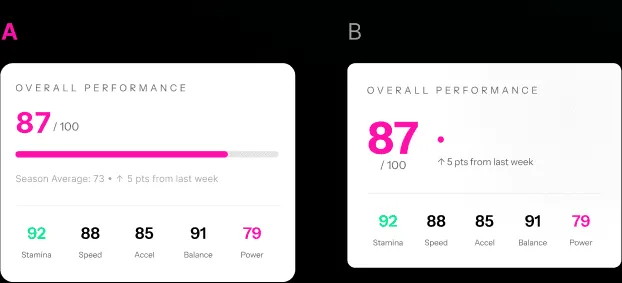
Compared two versions of the app interface with 12 participants to see which layout helps athletes understand performance metrics faster and more intuitively.
75% of users preferred A
Fatigue alert
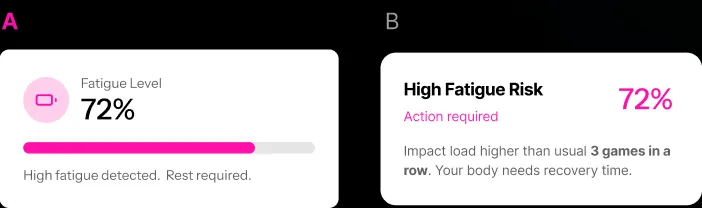
66% of users preferred A
Recovery score
83% of users preferred A
Areas for improvement
58% of users preferred A
Overall performance
User testing
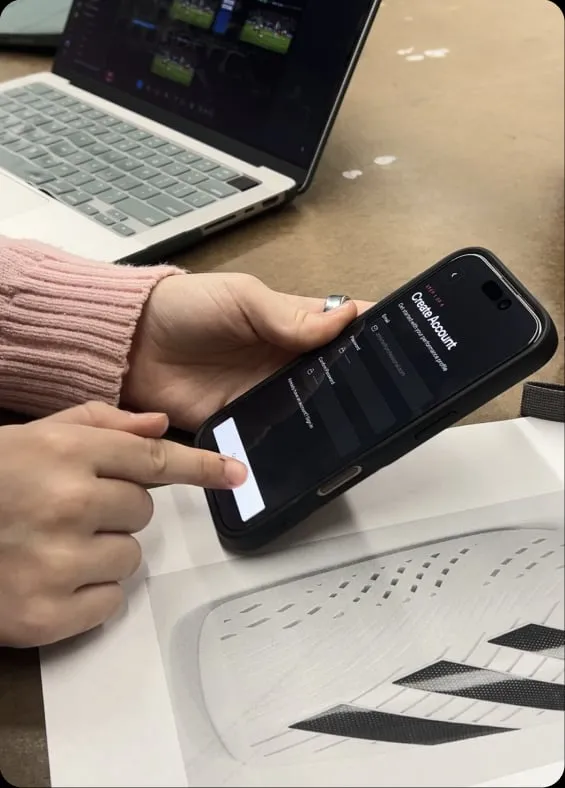
Real-user feedback
Tested the IMPACT app with 3 users.
Users valued
- Easy-to-navigate onboarding
- Consistent use of icons
- Knowing where they are in the system
Could improve on
- Condensing colors
- Simplifying animations
- Primary vs. secondary buttons
Final design
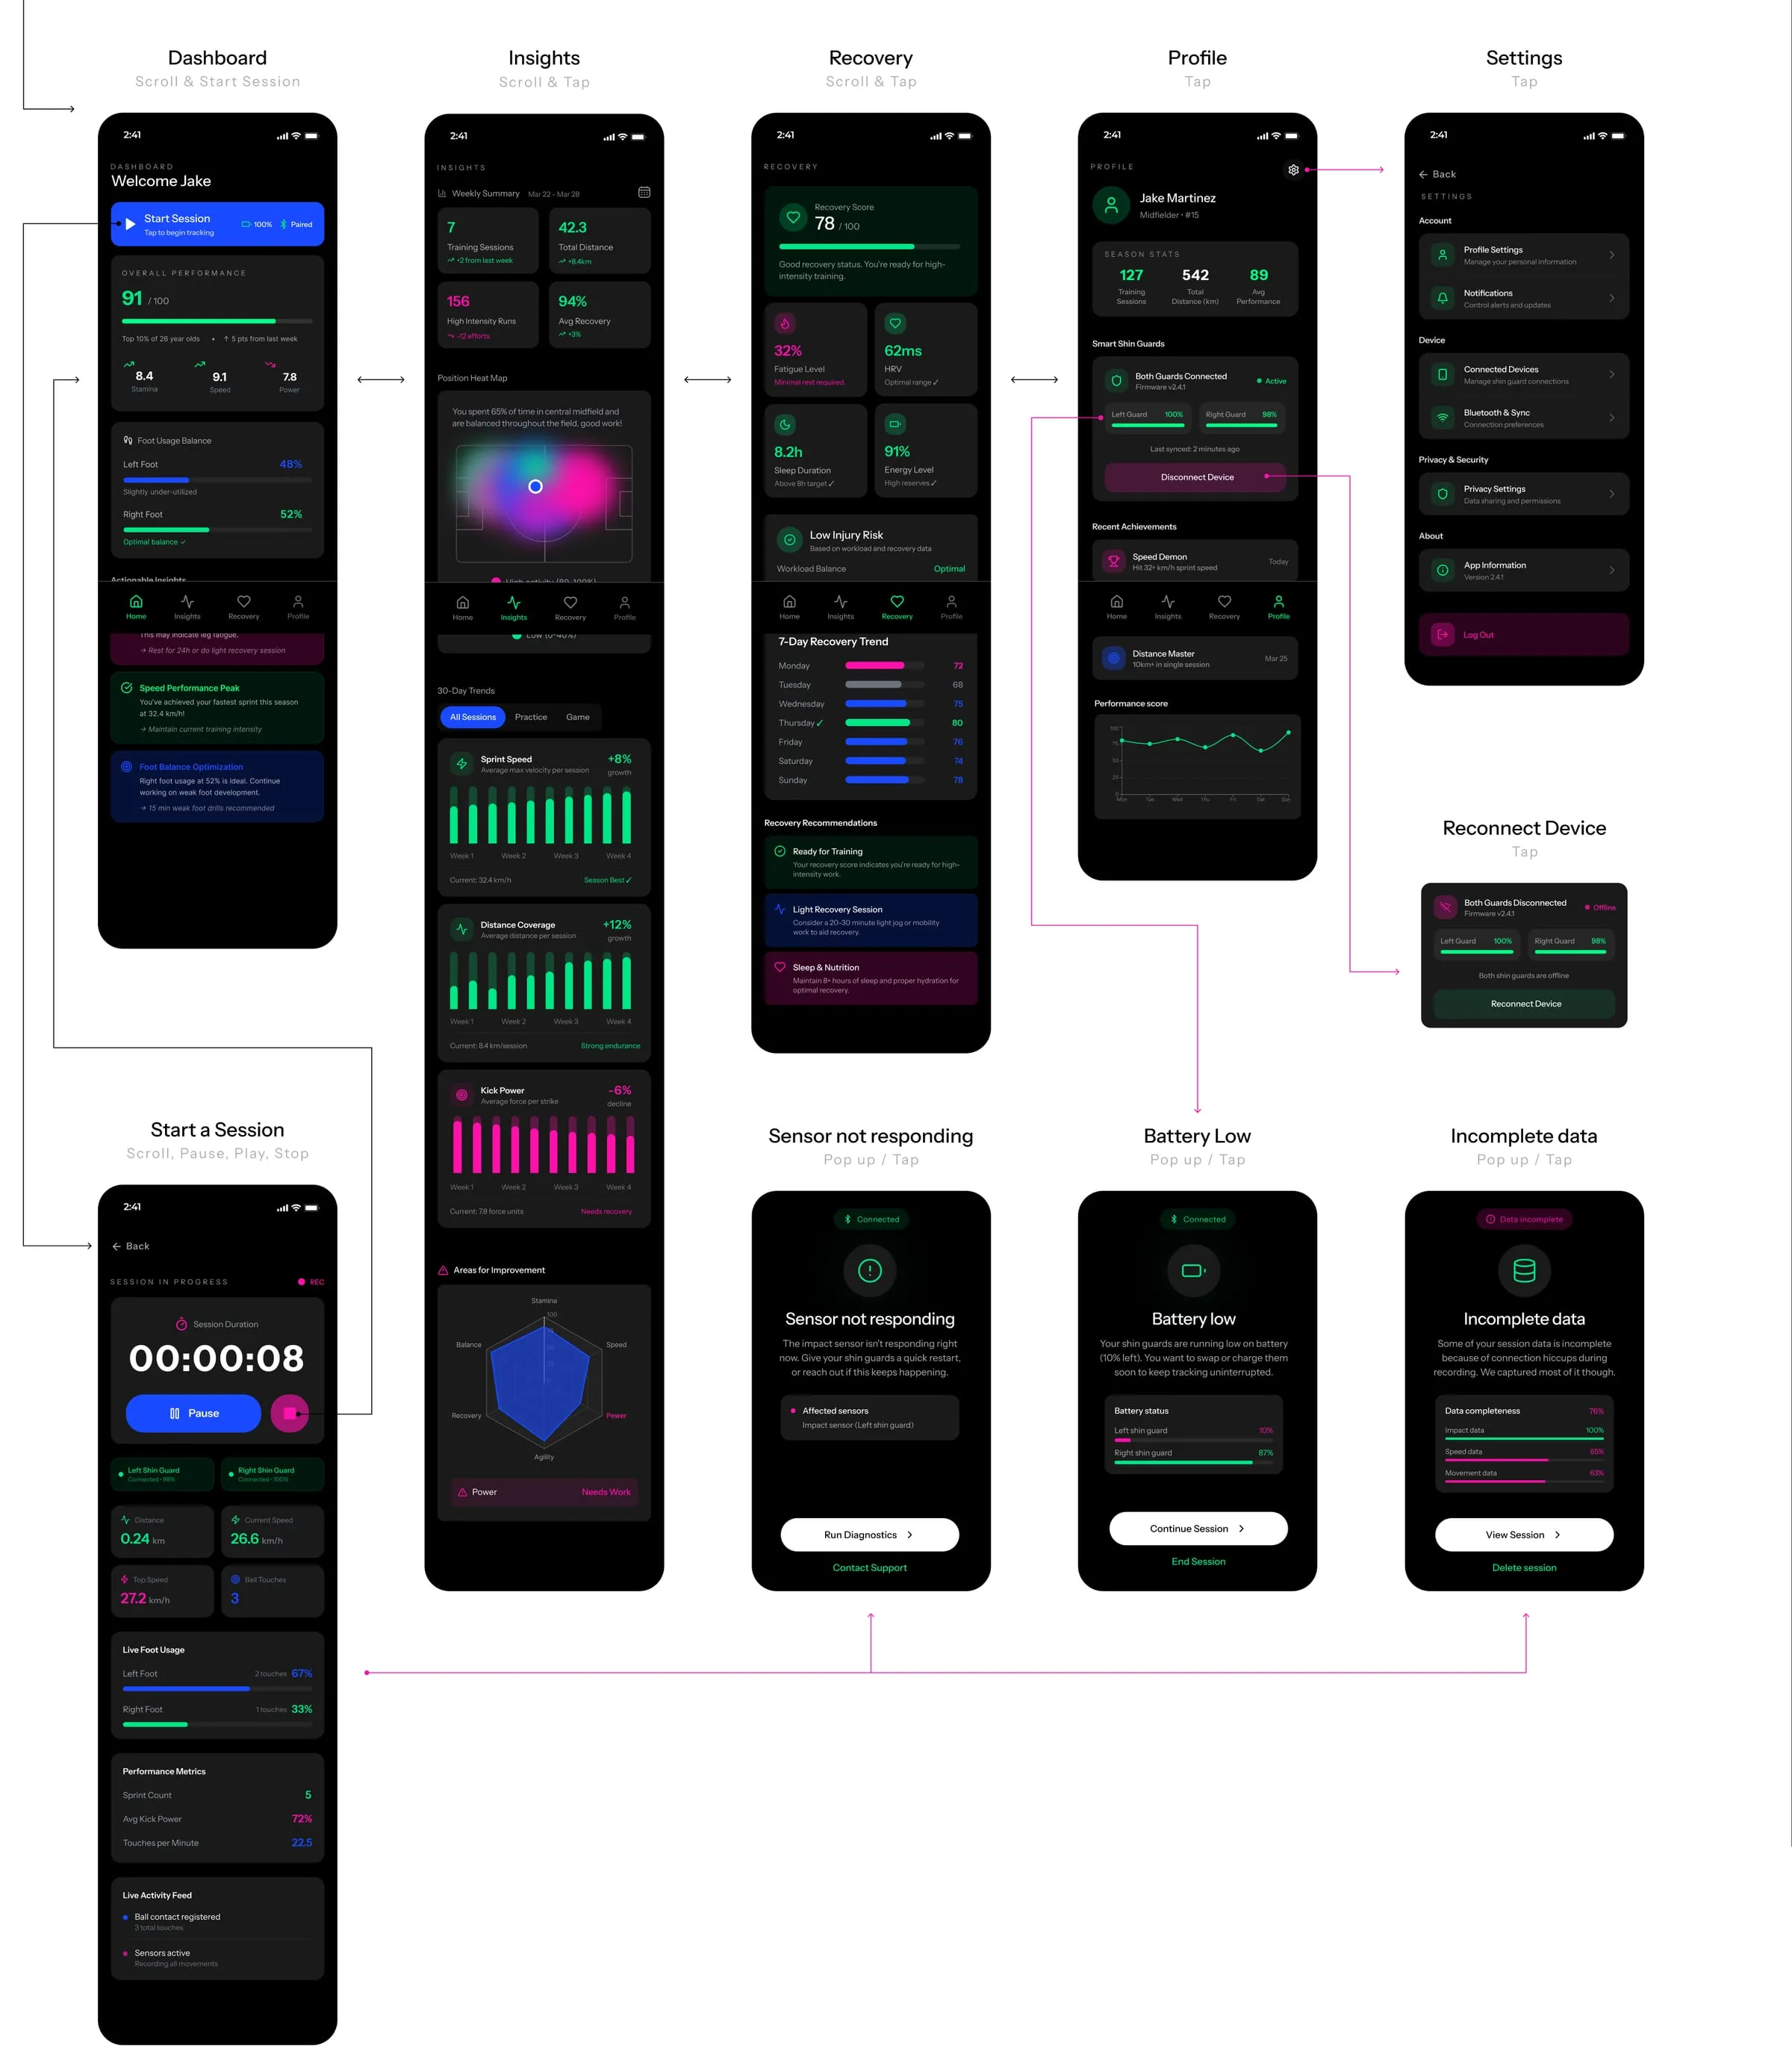
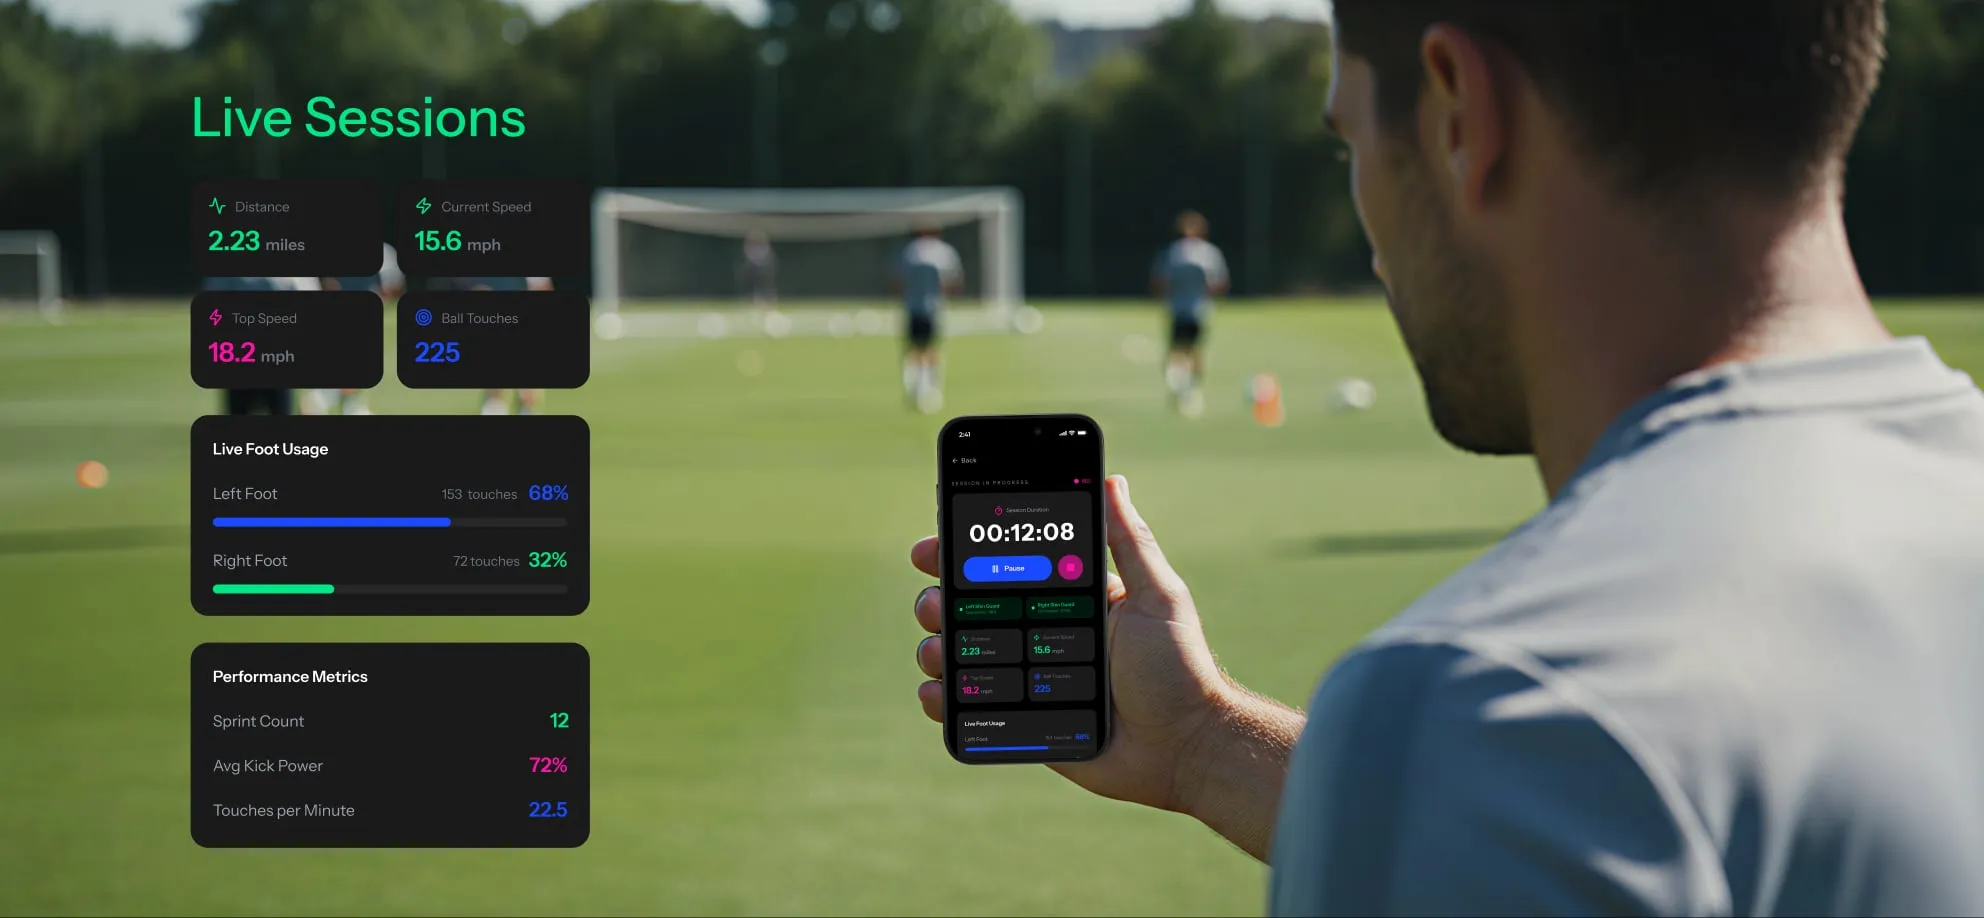
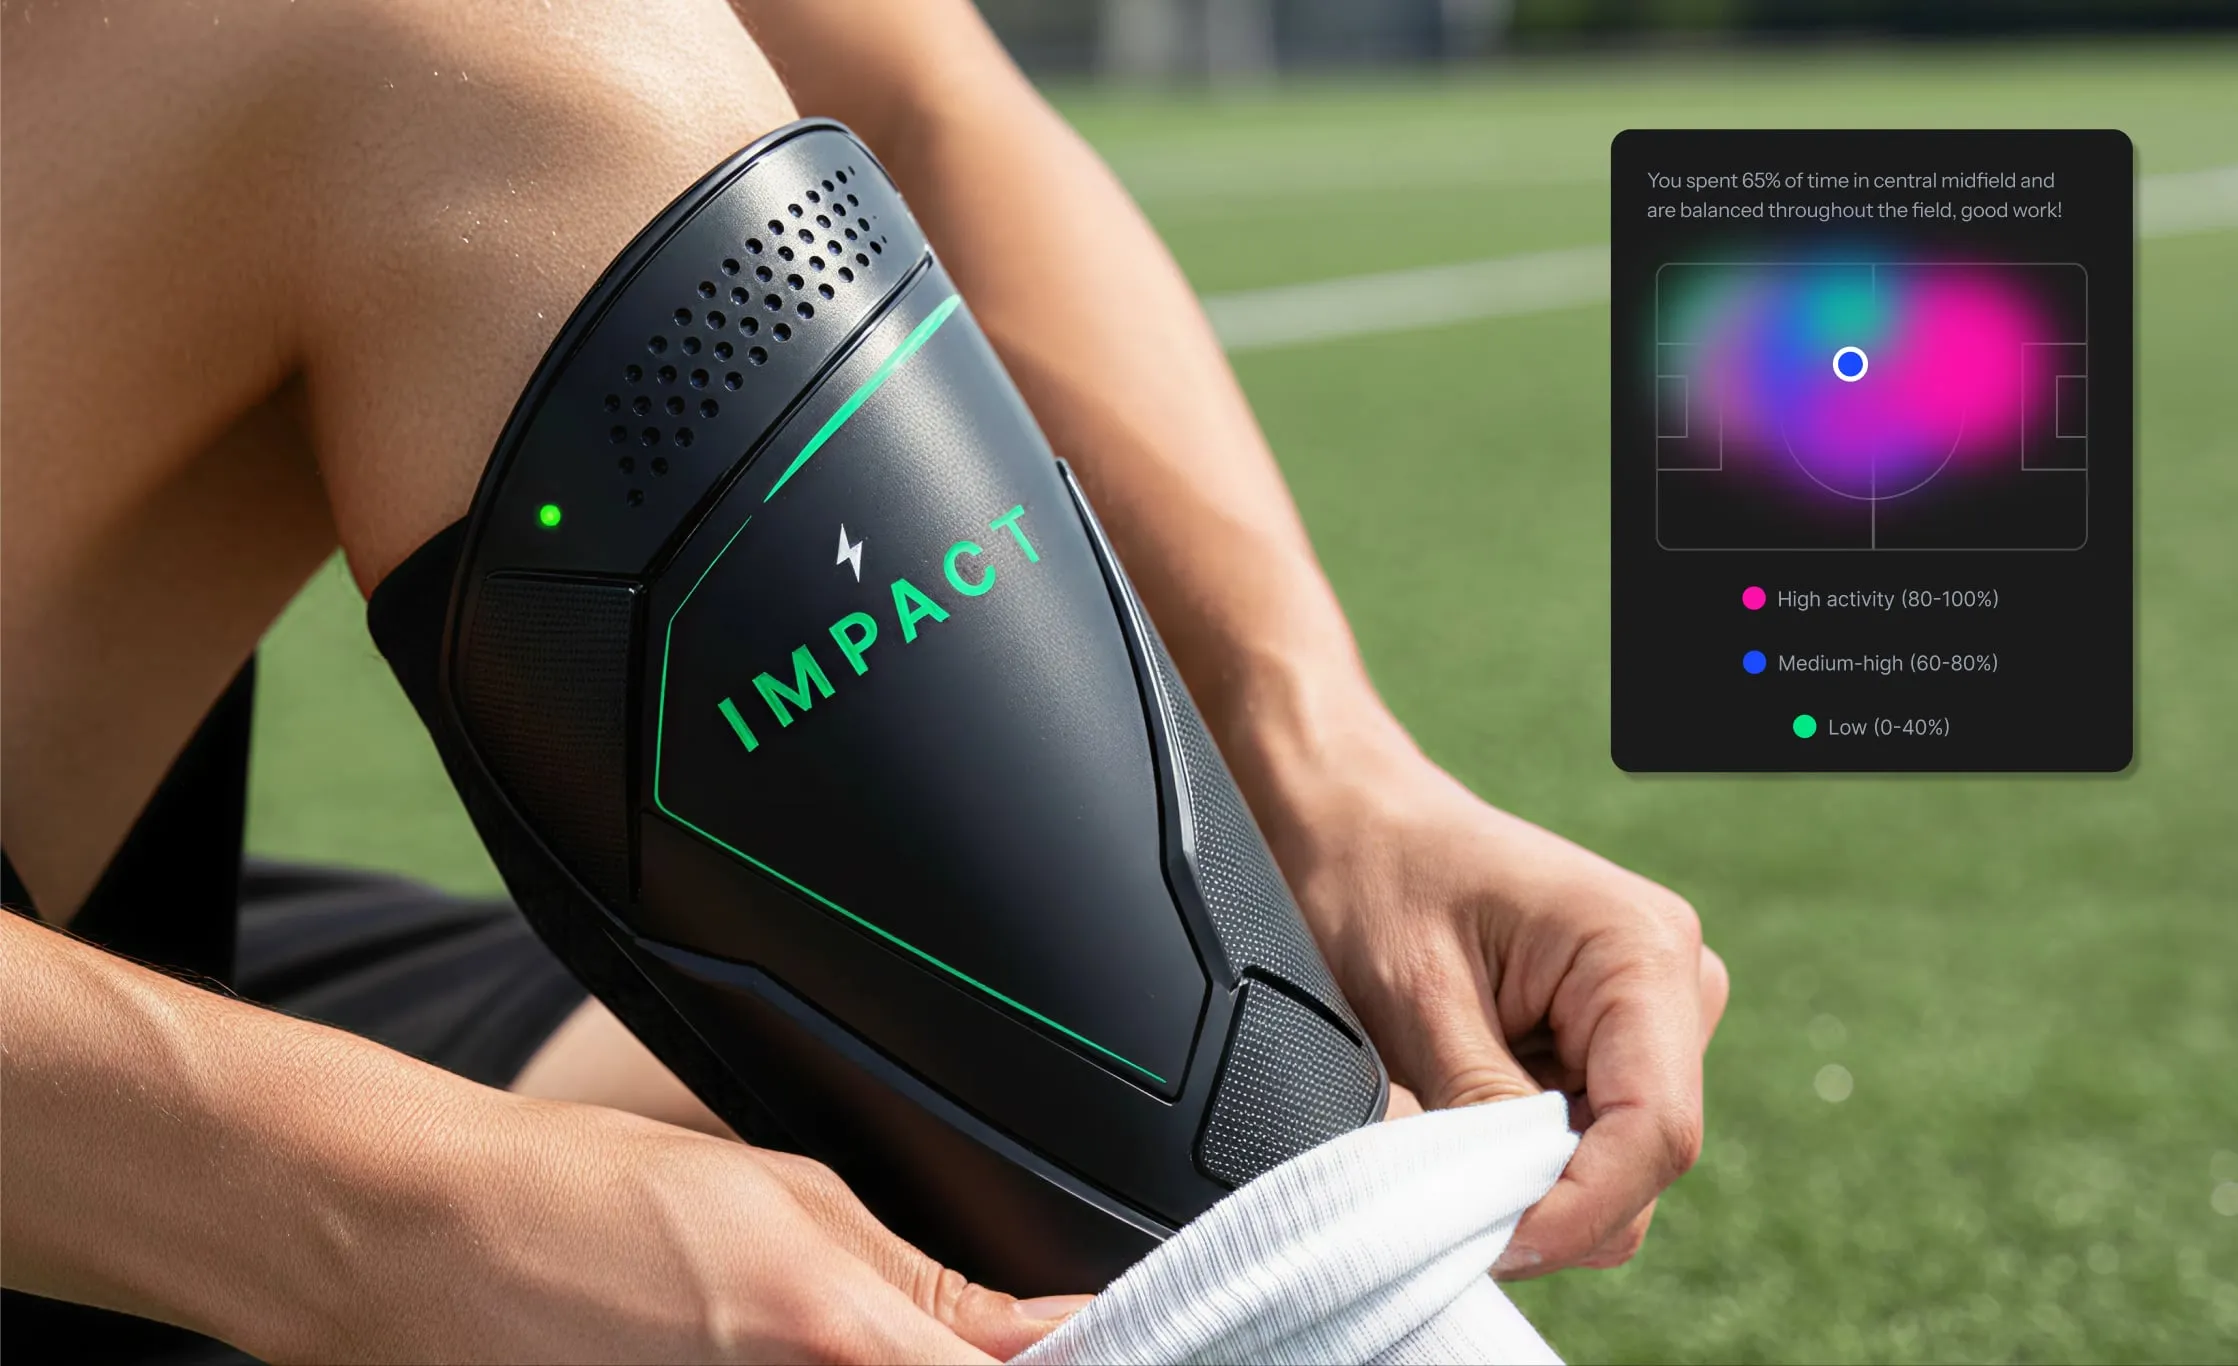
The core app brings everything together: a dashboard to start sessions, insights with a position heat map and 30-day trends, recovery tracking, and a profile with achievements. Error states cover sensors that stop responding, low battery and incomplete data.
Try the App
Tap through the IMPACT app, from signing in to a player’s match insights.
Things to try
- Sign up or log in from the welcome screen.
- Start a session from the dashboard.
- Open your insights: the position heat map, 30-day trends and recovery.
Design system
Branding coming to life
- Primary action
#1A4AFF - Secondary action
#00E786 - Error / risk
#FF10AA - Black
#000000 - White
#FFFFFF - Text
#A3A3A3 - Card 1
#1A1A1A - Card 2
#262626
Primary: headings and body
Instrument Sans
Measure Every Moment
- Regular 400
- Medium 500
- Semi Bold 600
- Bold 700
Secondary: data labels and captions
Inter
Top Speed 27.2 km/h
- Regular 400
- Medium 500
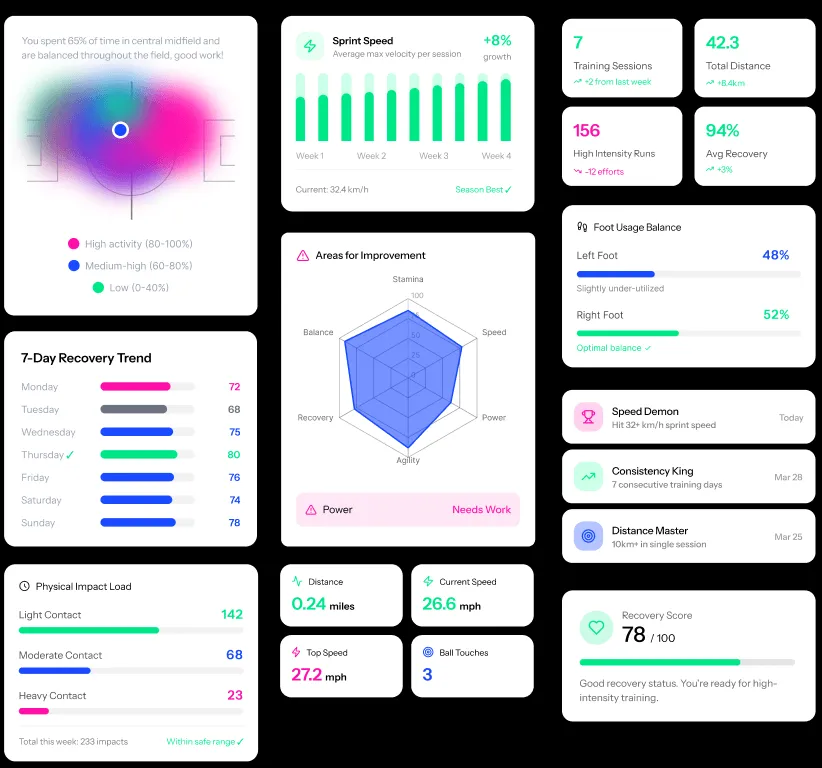
Data visualization
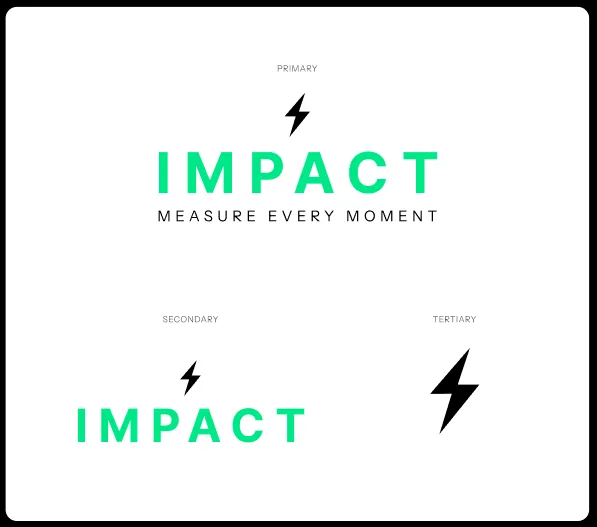
Logo variations
Gallery